Quarterly Outlook: Q2 2025
Slower Growth Expected Amid Shifting Trade Policies
Main Takeaway
The U.S. economy shows early signs of slowing in 2025 as uncertain trade policy rattled markets in the first quarter and into early April. As of April 3, the Atlanta Fed projected a 2.8% contraction for the first quarter, driven by slower consumer spending and a surge in imports ahead of tariffs.
Top Risks
The risk of a broader trade was has escalated with the Trump administration’s in early April announcement of new tariffs, which triggered swift and negative responses from the market and U.S. trade partners. Consumer spending has slowed, consumer confidence has declined and small business uncertainty is nearing its highest levels since the 1970s.
Sources of Stability
The consensus odds of a recession remain low at around 35%. Some challenges that slowed economic growth in the first quarter, like poor weather and a spike in imports ahead of potential tariffs, are unlikely to happen again in the second quarter. While the tariffs in particular raised uncertainty, it is anticipated this will most likely cause a temporary slowdown.
Economic Spotlight: U.S. Tariffs – A Shock to the System?
Policy changes often have a domino effect on the economy. For example, if the government lays off workers, unemployment can rise, leading to lower consumer spending and slower economic growth. Similarly, tariffs may drive up pries consumers pay for imported good, increasing demand for domestic products and potentially contributing to inflation. The overall impact depends on the significance and duration of these changes.
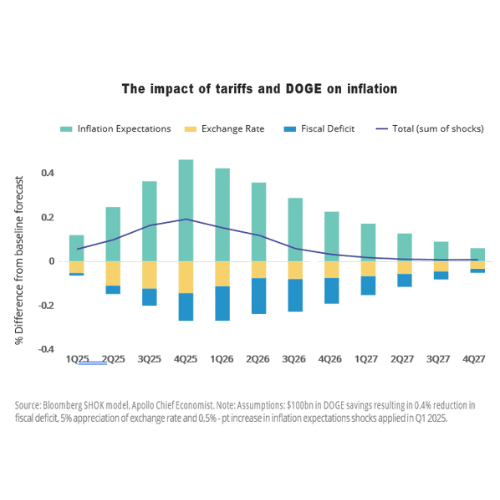
Apollo Global Management used a model similar to the Federal Reserve’s model of the U.S. economy to assess the potential effects of tariffs and DOGE policies of GDP and inflation. Their projections show GDP could drop about 0.5% over the coming quarters, while inflation could rise slightly by 0.2%.
In other words, these factors are expected to cause a small and temporary economic slowdown – pushing prices up a little and slowing growth. However, the impact is not expected to be strong enough to cause a recession.

Key Areas to Watch
U.S. Economic Growth
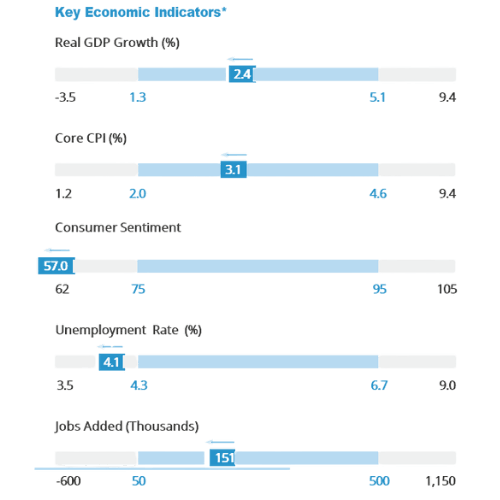
The U.S. economy grew at an annualized rate of 2.4% in Q4, but early signs of slowing have emerged this year. As of April 3, the Atlanta Fed projected a 2.8% contraction in real GDP for Q1. This reversal is largely driven by an 11.9% surge in U.S. imports – the second-largest monthly increase since 1992 – coupled with weaker-than-expected ISM manufacturing data.
Inflation Trajectory
Inflation remains above the Fed’s 2% target, but recent data offers some encouraging signs. In February, the Consumer Price Index (CPI) rose just 0.2%, bringing the annual inflation rate down to 2.8% from 2.9% in December. Shelter costs, the biggest driver of inflation, climbed 4.2%, their slowest pace since December 2021. However, the inflation outlook remains highly uncertain, as future tariff policies add another layer of unpredictability.
Monetary Policy
The Fed has held the federal funds target rate steady at 4.25%-4.50% following both its January and March meetings. At the March meeting, Chair Powell emphasized elevated uncertainty around the future path of interest rates, largely stemming from the new administration’s evolving trade, immigration, and fiscal policies.
Fiscal Policy
Projections from the Congressional Budget Office’s (CBO) latest Budget and Economic Outlook underscore the urgency posed by rising national debt. Over the decade, federal spending is expected to average 24% of GDP, while revenues will lag at just 18% of GDP. These projections assume the scheduled expiration of key provisions in the Tax Cuts and Jobs Act (TCJA) at the end of 2025. If those tax cuts are extended without offsetting measures, deficits could widen further. However, the Trump administration aims to reduce the deficit to 3% of GDP by 2028.
Key Areas to Watch
Labor Market
The latest labor market data would suggest a stable job market, with 151,000 jobs added in February and unemployment edging up to 4.1%. January’s JOLTS report showed job openings rising to 7.7 million, maintaining a 1.1-to-1 ratio of openings to workers, while hires and layoffs remained steady. However, a report from Challenger, Gray & Christmas revealed planned job cuts surged 245% to 172,017 in February, the highest since July 2020
Consumer Spending
Consumer spending slowed from its Q4 pace, signaling headwinds for the economy. The Conference Board’s Consumer Confidence Index dropped by 7.2 points to 92.9, the fourth straight monthly decline. The Expectations Index, which gauges consumers’ short-term outlook on income, business, and labor market conditions, plummeted to 65.2 – well below the critical recession-signaling threshold of 80.
Global Economy
Global economic growth remained sluggish in the fourth quarter with the euro area and U.K. posting negligible GDP gains of 0.0% and 0.1% respectively while Japan fared only slightly better, expanding 0.6%. Consensus estimates for a global recession in 2025 have inched higher in Q1 but remain relatively low, holding at 35% or less for the U.S., U.K., and Europe.
Yield Curve
The fixed income markets revered their Q4 trend and Treasury yields declined across the curve in Q1. Yields on the 2-year, 5-year, 10-year, and 30-year Treasuries fell by 0.36%, 0.42%, 0.35% and 0.19% respectively. The Treasury curve steepened ever so slightly, with the 2-year/10-year spread widening by 0.01% to 0.34%. Rates moved lower amid mounting concerns over an economic slowdown fueled by escalating trade tensions.
Economic and Market Snapshot
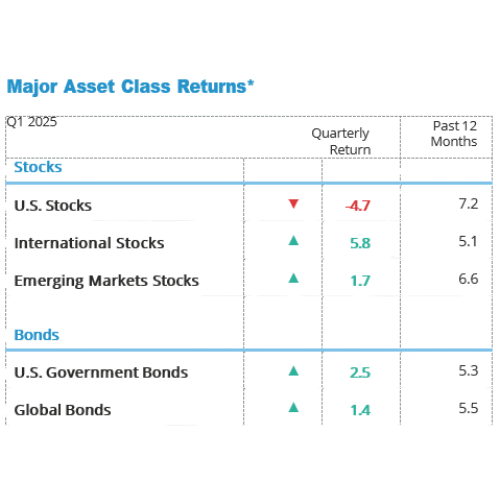
Global equity markets were once again mixed in the first quarter with U.S. markets falling while international stocks rose sharply. Small value lagged over the quarter both domestically and internationally, with U.S. small value stocks underperforming the broad U.S. market by 3.0% and international small value trailing broad international markets by 0.4%.
Fixed income returns in the U.S. were strongly positive in the first quarter as rates fell over the quarter. The decrease in rates was driven by mounting concerns over an economic slowdown fueled by escalating trade tensions.


Investment Planning Implications
Where do markets go from here?
The not-so-magnificent 7. The once-shining stars of the market, known as the “Magnificent 7”, have dimmed in 2025, with every member under water through the first quarter. At the end of Q1, the group averaged a disappointment -15.7% year-to-date return, lagging a significant 11.0% behind the broader Russell 3000 index.
International is back. After years of underperformance, international markets are making a strong comeback in 2025. Through March 31, international developed stocks, as measured by the MSCI World ex-USA IMI Index, have posted impressive gains of 5.8%, outpacing the Russell 3000 Index by a robust 10.5% margin. With more modest valuations across international markets, we believe this rally could have the legs to sustain itself over the long term.
Interest rate uncertainty persists. The outlook for interest rates remains uncertain following the latest Federal Open Market Committee (FOMC) meeting. While the updated Fed dot plot continues to project two additional rate cuts in 2025, Chair Powell emphasized during his press conference that major policy shifts under the new administration will take time to fully materialize. As a result, the Fed is positioned to remain patient and wait for greater clarity making further moves.
What are the investment planning implications?
Stay the course. The sharp sell-off in early April triggered by worse-than-anticipated tariff announcements reminds us that volatility is not only common, but often sudden. Investors who react to headlines risk missing the longer-term recovery that historically follows such pullbacks.
Expect volatility. Uncertain tariff policies have fueled a large increase in stock market volatility. Over the past 45 years, the S&P 500 has experienced an average intra-year decline of -14%. Yet, despite these dips, the index still posted positive annual returns in 34 of those years. In our view, the biggest risk to long-term financial plans is overreacting to short-term volatility.
Explore all of your options. Incorporating new and unique sources of risk and return, such as alternative investments, can be an effective way to diversify exposure to traditional stock and bond market risks. Alternative investments, including private credit, reinsurance, and market neutral strategies, often exhibit lower correlations with public markets, providing portfolio stability during periods of equity and fixed income volatility, though they may not be suitable for all investors.
Appendix
Page 3:
1 U.S. Bureau of Labor Statistics. “Gross Domestic Product, 4th Quarter and Year 2024 (Third Estimate), GDP by Industry, and Corporate Profits” March 27, 2025
2 Atlanta Fed GDPNow estimate as of March 26, 2025
3 Focus Partners Wealth. “Monthly Investment Commentary: March 2025” March 6, 2025
4 U.S. Bureau of Labor Statistics. 12-month percentage change, Consumer Price Index, selected categories. February 2025
5 Bipartisan Policy Center. “Visualizing CBO’s Budget and Economic Outlook: 2025” February 4, 2025
6 Americanprogress.org. “Scott Bessent’s 3 Percent Deficit Target Would Require Massive Cuts to Anti-Poverty Programs and Middle-Class Tax Increases,” Jan. 15, 2025
Page 4:
1 U.S. Bureau of Labor Statistics. “Employment Situation Summary” March 7, 2025
2 CNBC. “Job openings see gains in January in a sign of labor market stability” March 11, 2025
3 Reuters. “US announced job cuts surge 245% in February on federal government layoffs” March 6, 2025
4 The Conference Board. “US Consumer Confidence tumbled again in March” March 25, 2025
5 Trading Economics
Page 5:
Major Asset Class Returns: The index representation for the Major Asset Class Returns is as follows: U.S. stocks are represented by the Russell 3000 Index, international stocks by the MSCI World ex U.S. IMI Index, emerging markets by the MSCI Emerging Markets IMI Index, U.S. government bonds by the Bloomberg Government Intermediate Total Return Index, and global bonds by the FTSE World Government Bond 1-5 Year Index. Past performance is not a guarantee of future results. Indexes are unmanaged baskets of securities that are not available for direct investment by investors. Index performance does not reflect the expenses associated with the management of an actual portfolio. Information from sources deemed to be reliable, but its accuracy cannot be guaranteed.
Key Economic Indicators: Sources: Bureau of Economic Analysis (BEA) for real GDP growth. Real GDP is the annual rate of change of real gross domestic product, seasonally adjusted. Bureau of Labor Statistics (BLS) for core CPI. The core consumer price index (CPI) is the annual rate of change, seasonally adjusted, and excludes food and energy. Consumer sentiment is from the University of Michigan’s consumer sentiment index. Unemployment rate is reported by the BLS, and jobs added is based on nonfarm payroll employment reported by the BLS. Retrieved from FRED, Federal Reserve Bank of St. Louis. For all indicators, the boxed number reflects the latest reading, and the line above the box shows the change since the last update. The shaded areas reflect normal readings compared to history (based on the 25th-75th percentile of historical measures), while areas outside the dark blue reflect more extreme readings compared to history. The ranges are based on the percentile values of historical readings for each economic figure. The lowest number reflects the 5th percentile value, the bottom of the blue range reflects the 25th percentile, the top of the blue range is the 75th percentile, and the highest value reflects the 95th percentile. All ranges are based on the full period available. To account for population and employment, the ranges presented for jobs added are based on the percent change in employment numbers, using December 2022 as the base year.
Please note that the information presented in this material is for general purposes only and should not be acted upon without first seeking professional advice. This material has been authorized by Focus Partners Advisor Solutions (FPAS), and CLF makes no representation or warranty regarding the accuracy of the information provided. It is being used with permission and was originally published by FPAS.
Copper Leaf Financial has established key strategic partnerships with elite financial industry leaders including FPAS. These alliances put us in the optimum position to help clients reach their personal and financial goals while retaining our independence. We are truly independent fiduciaries offering high-level services without being accountable to a large parent corporation unlike many of our competitors who attempt to pick stocks and outsmart the market. As a member of FPAS network of more than 140 independent wealth management firms we have strengthened our ability to help clients make the best decisions by providing them with ideas, insights, and intelligence from industry thought leaders. Through our strategic partnerships we are in a unique position to deliver comprehensive solutions to our clients. This is true wealth management.
